Vector Poisson equation in a rectangle#
\[\begin{split}
\mathbb{S}_{\mathbf{u}}
\begin{cases}
\Omega = [0, L_x] \times [0, L_y] \\
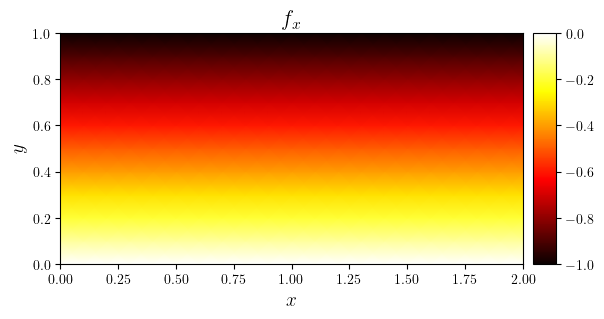
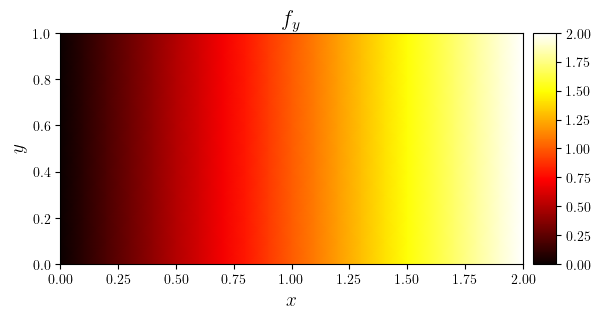
\textbf{f}(x,y)=-y\textbf{e}_x + x\textbf{e}_y \\
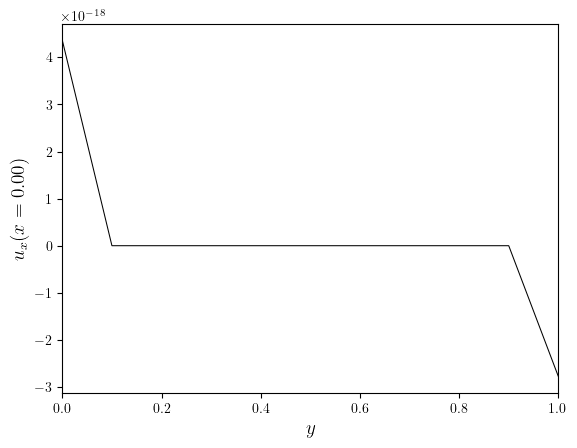
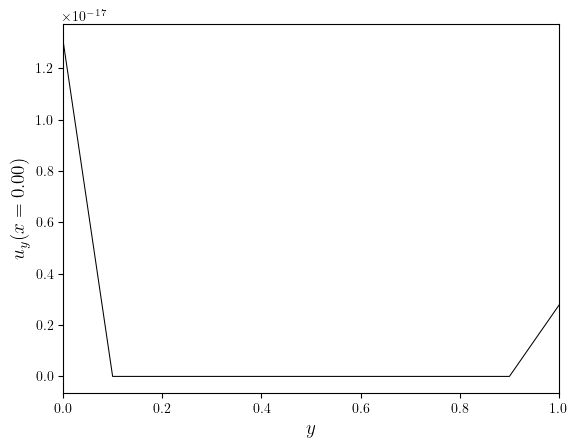
\textbf{u}_{\text{D}}(x=0,y)=\textbf{0} \\
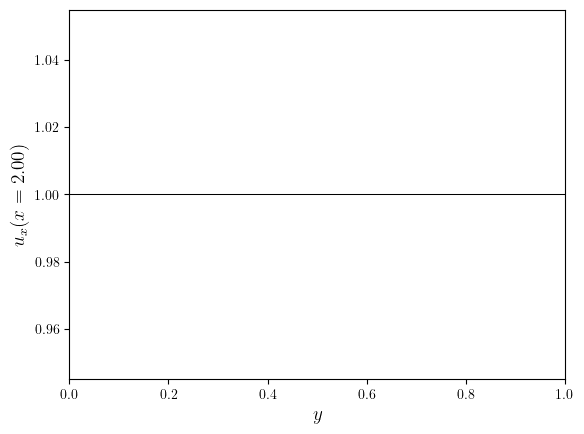
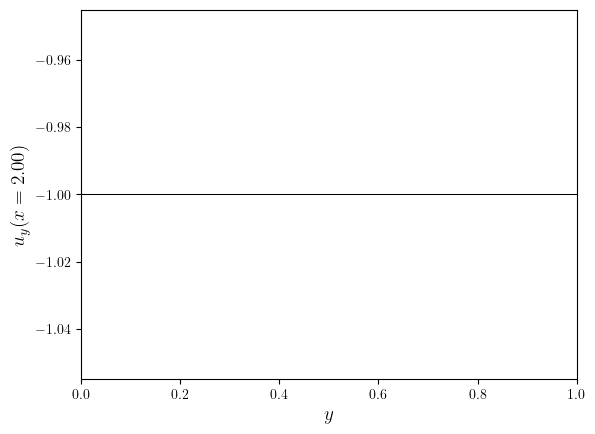
\textbf{u}_{\text{D}}(x=L_x,y)=\textbf{e}_x -\textbf{e}_y \\
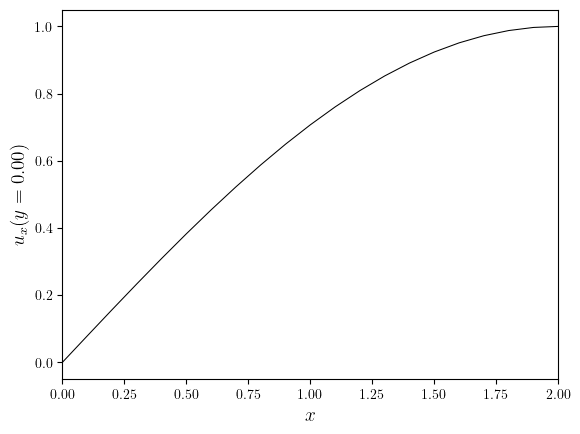
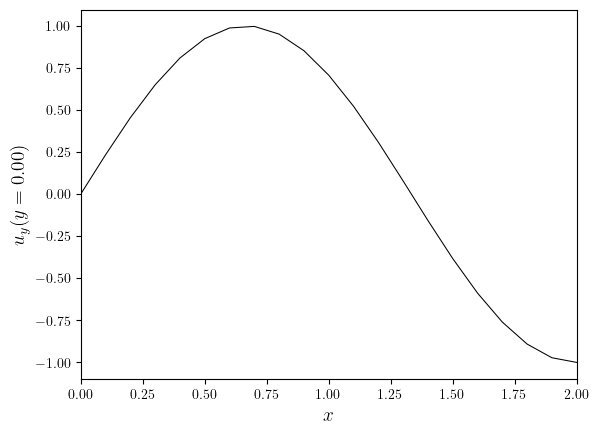
\textbf{u}_{\text{D}}(x,y=0)\sin\left(\frac{\pi x}{2L_x}\right)\textbf{e}_x + \sin\left(\frac{3\pi x}{2L_x}\right)\textbf{e}_y \\
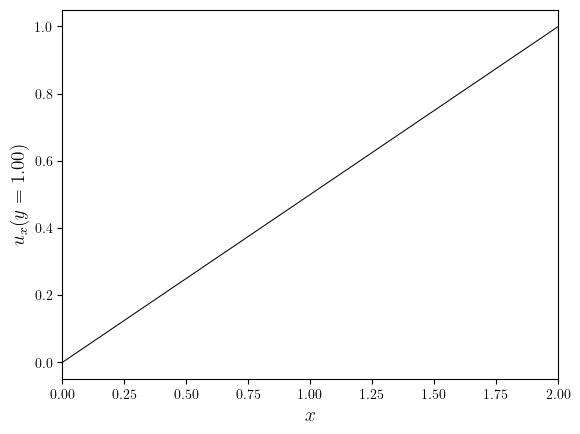
\textbf{e}_x\cdot\textbf{u}_{\text{D}}(x,y=L_y)=\frac{x}{L_x} \\
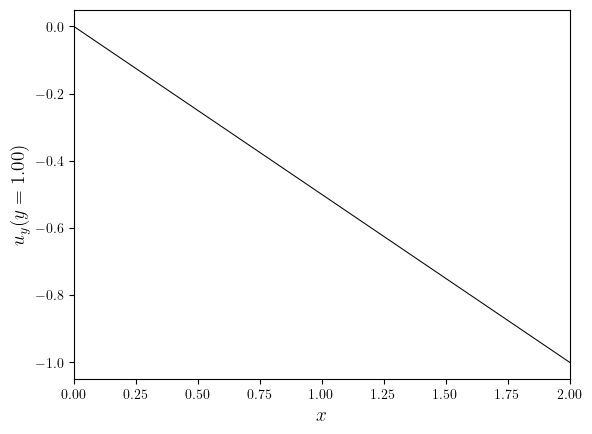
\textbf{e}_y\cdot\textbf{u}_{\text{D}}(x,y=L_y)=-\frac{x}{L_x} \\
\end{cases}
\end{split}\]
import numpy as np
from lucifex.mesh import rectangle_mesh, mesh_boundary
from lucifex.fem import Function, Constant, cross_section_grid
from lucifex.solver import bvp, BoundaryConditions
from lucifex.plt import plot_colormap, plot_line, save_figure
from lucifex.utils.fenicsx_utils import extract_component_functions
from lucifex.pde.poisson import poisson
Lx = 2.0
Ly = 1.0
mesh = rectangle_mesh(Lx, Ly, 20, 10)
boundary = mesh_boundary(
mesh,
{
"left": lambda x: x[0],
"right": lambda x: x[0] - Lx,
"lower": lambda x: x[1],
"upper": lambda x: x[1] - Ly,
},
)
f = Function((mesh, 'P', 1, 2), lambda x: (-x[1], x[0]), name='f')
u_lower = (
lambda x: np.sin(0.5 * np.pi * x[0] / Lx),
lambda x: np.sin(1.5 * np.pi * x[0] / Lx),
)
ux_upper = lambda x: x[0] / Lx
uy_upper = lambda x: ux_upper(-x)
bcs = BoundaryConditions(
('dirichlet', boundary['left'], (0.0, 0.0)),
('dirichlet', boundary['right'], Constant(mesh, (1.0, -1.0))),
('dirichlet', boundary['lower'], u_lower),
('dirichlet', boundary['upper'], ux_upper, 0),
('dirichlet', boundary['upper'], uy_upper, 1),
)
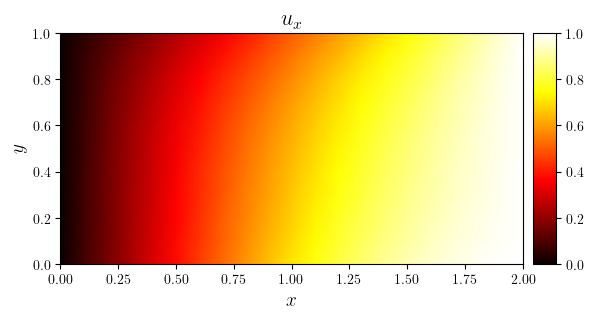
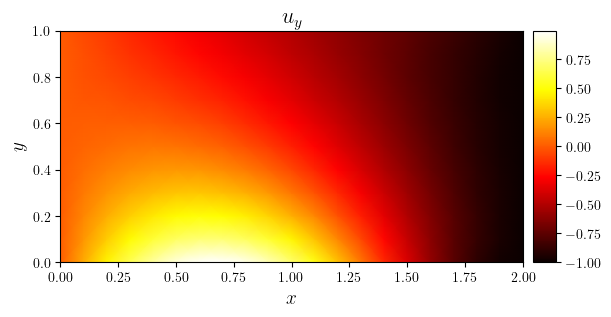
u = Function(f.function_space, name='u')
u_solver = bvp(poisson, bcs)(u, f)
u_solver.solve()
ux, uy = extract_component_functions(('P', 1), u, names=('ux', 'uy'))
fx, fy = extract_component_functions(('P', 1), f, names=('fx', 'fy'))
fig, ax = plot_colormap(fx, title='$f_x$')
fig, ax = plot_colormap(fy, title='$f_y$')
fig, ax = plot_colormap(ux, title='$u_x$')
fig, ax = plot_colormap(uy, title='$u_y$')
save_figure('uy(x,y)', thumbnail=True)(fig)
for axis in ('x', 'y'):
    x_label = 'y' if axis == 'x' else 'x'
    for i in (0, -1):
        ux_cs, value = cross_section_grid(ux, axis, i, use_cache=False)
        plot_line(ux_cs, x_label=f'${x_label}$', y_label=f'$u_x({axis}={value:.2f})$')
        uy_cs, value = cross_section_grid(uy, axis, i, use_cache=False)
        plot_line(uy_cs, x_label=f'${x_label}$', y_label=f'$u_y({axis}={value:.2f})$')