Diffusion of a Gaussian in a rectangle#
\[\begin{split}
\mathbb{S}
\begin{cases}
\Omega = [0, L_x] \times [0, L_y] \\
u_{\text{D}}(x,y=0) \\
u_{\text{D}}(x,y=L_y)=0 \\
u_{\text{N}}(x=0,y) \\
u_{\text{N}}(x=L_x,y)=0 \\
\mathsf{D}=D\mathsf{I} \\
\end{cases}
\end{split}\]
import numpy as np
from lucifex.mesh import rectangle_mesh, mesh_boundary
from lucifex.fdm import BE, FunctionSeries, diffusive_timestep
from lucifex.fem import Constant
from lucifex.solver import ibvp, BoundaryConditions
from lucifex.viz import plot_colormap, plot_line, save_figure, create_animation, display_animation
from lucifex.utils import cross_section
from lucifex.pde.diffusion import diffusion

Nx = 100
Ny = 100
Lx = 2.0
Ly = 1.0
mesh = rectangle_mesh(Lx, Ly, Nx, Ny)
boundary = mesh_boundary(
    mesh,
    {
        "left": lambda x: x[0],
        "right": lambda x: x[0] - Lx,
        "lower": lambda x: x[1],
        "upper": lambda x: x[1] - Ly,
    },
)

dt = Constant(mesh, 0.01, name='dt')
d = Constant(mesh, 0.1, name='d')

h = Lx/ Nx
dt_diffusive = diffusive_timestep(d, h)
courant = dt.value / dt_diffusive

ics = lambda x: np.exp(-((x[0] - Lx/2)**2 + (x[1] - Ly/2)**2)/ (0.01 * Lx))
bcs_D = BoundaryConditions(
    ("dirichlet", boundary['lower', 'upper'], 0.0),
)
bcs_N =  BoundaryConditions(
    ("neumann", boundary['left', 'right'], 0.0),
)
u = FunctionSeries((mesh, 'P', 1), name='u', store=1)
u_solver = ibvp(diffusion, ics, bcs_D)(u, dt, d, BE, bcs=bcs_N)
t = 0.0
t_stop = 10.0
n = 0
n_stop = 10

while n < n_stop and t < t_stop:
    u_solver.solve()
    u.forward(t)
    t += dt.value
    n += 1
slc = slice(0, None)
x_lines, y_lines = [], []
for ui in u.series[slc]:
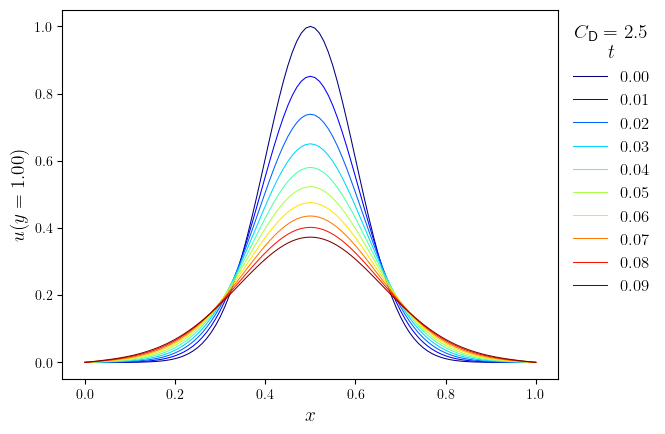
x_axis, x_line, y_value = cross_section(ui, 'x', 0.5)
x_lines.append((x_axis, x_line))
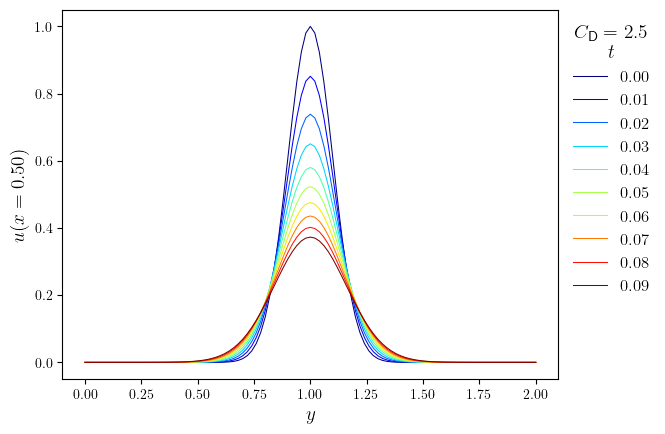
y_axis, y_line, x_value = cross_section(ui, 'y', 0.5)
y_lines.append((y_axis, y_line))
legend_title = f"$C_{{\mathsf{{D}}}}={courant}$\n\n$t$"
legend_labels = [f"{time:.2f}" for time in u.time_series[slc]]
fig, ax = plot_line(x_lines, legend_labels, legend_title, cyc='jet', x_label='$x$', y_label=f'${u.name}(y={y_value:.2f})$')
save_figure(f'u(x,y={y_value:.2f},t)', thumbnail=True)(fig)
fig, ax = plot_line(y_lines, legend_labels, legend_title, cyc='jet', x_label='$y$', y_label=f'${u.name}(x={x_value:.2f})$')
save_figure(f'u(x={x_value:.2f},y,t)')(fig)
title_series = [f'$u(t={t:.2f})$' for t in u.time_series]

anim = create_animation(
    plot_colormap,
    colorbar=(0, 1),
)(u.series, title=title_series)
anim_path = save_figure('u(x,y,t)', get_path=True)(anim)

display_animation(anim_path)
The Kernel crashed while executing code in the current cell or a previous cell.

Please review the code in the cell(s) to identify a possible cause of the failure.

Click <a href='https://aka.ms/vscodeJupyterKernelCrash'>here</a> for more info.

View Jupyter <a href='command:jupyter.viewOutput'>log</a> for further details.