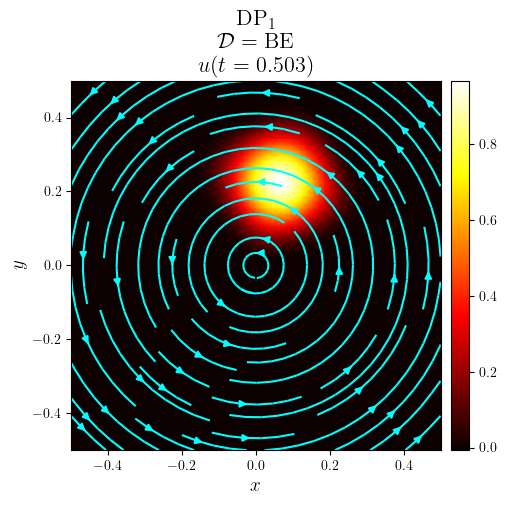
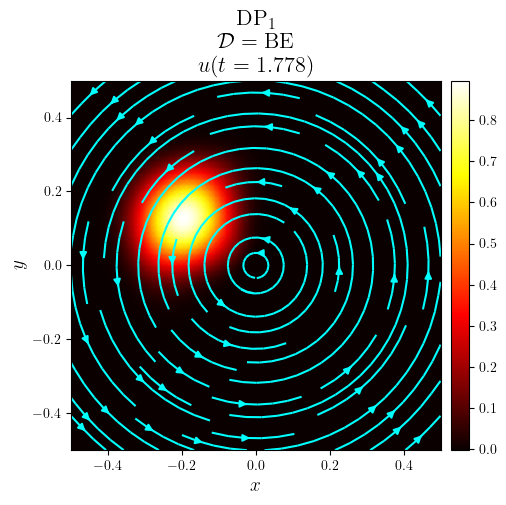
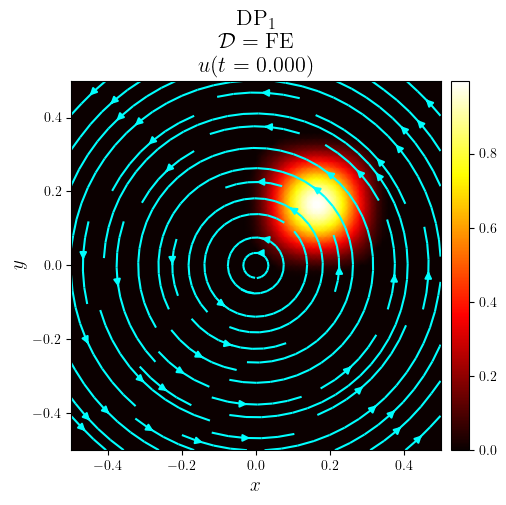
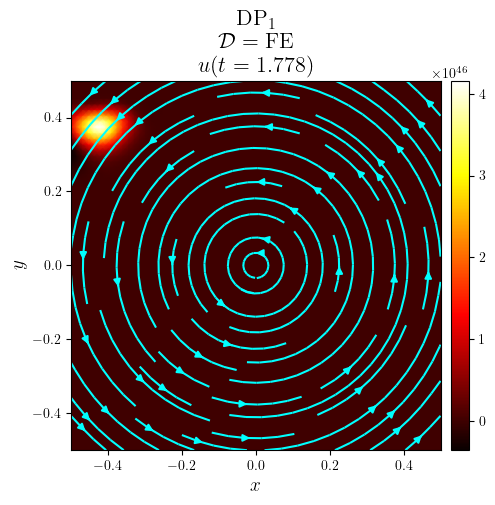
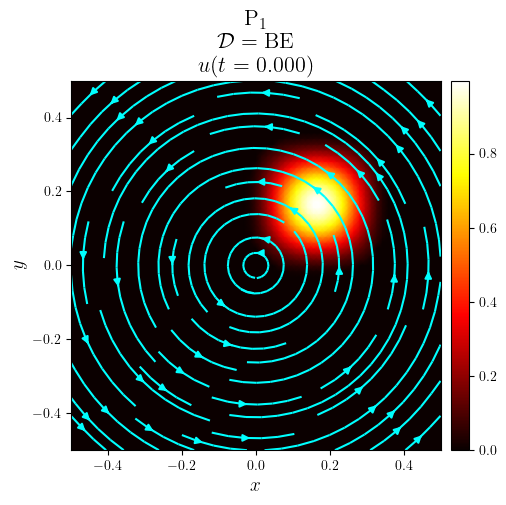
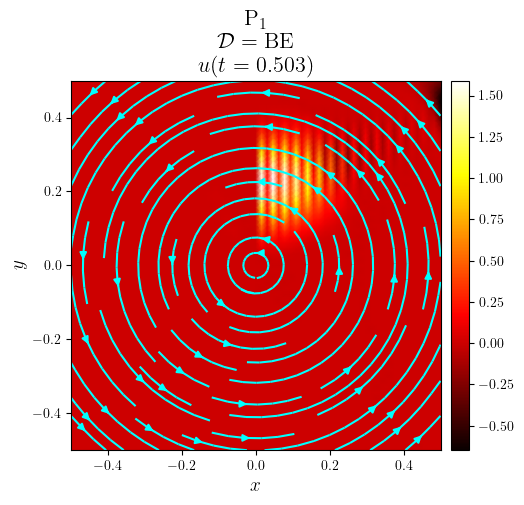
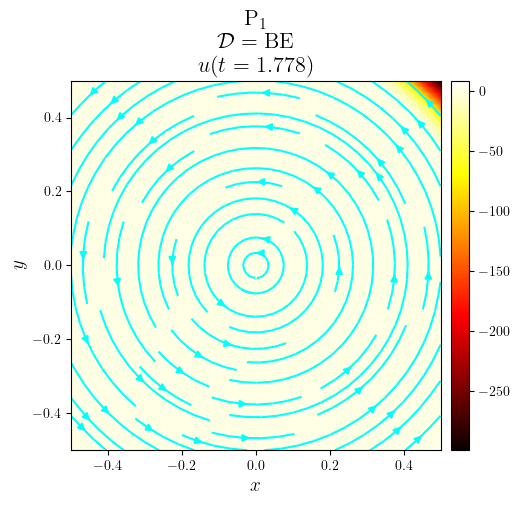
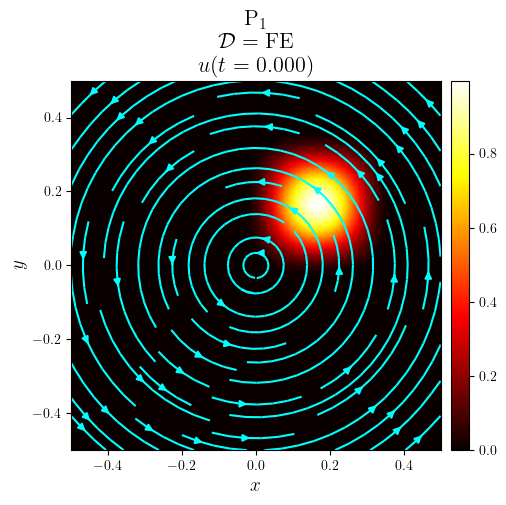
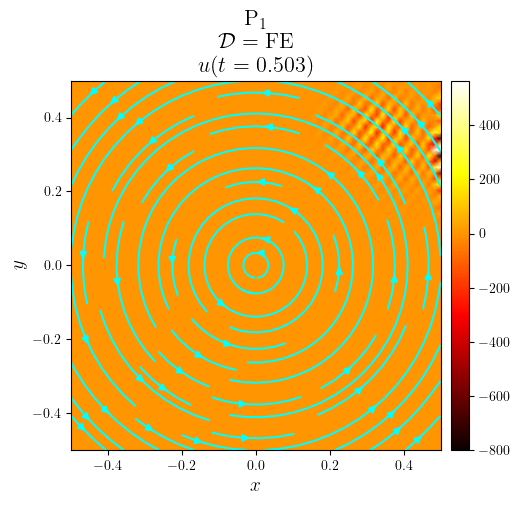
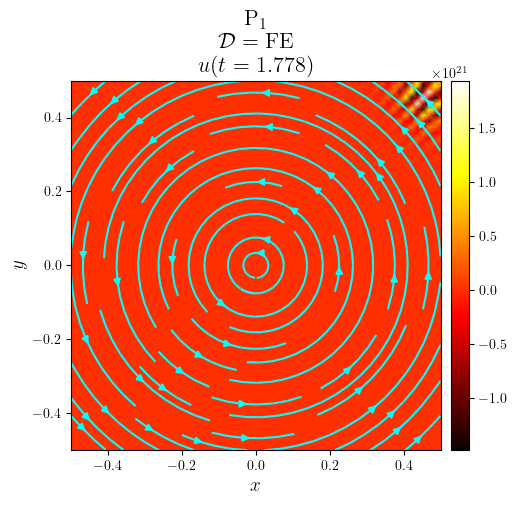
DG advection of a rotating cone in a rectangle#
Donea, J. & Huerta, A. (2003). Finite Element Methods for Flow Problems. \(\S 3.11.3\)
\[\begin{split}
\mathbb{S}
\begin{cases}
\Omega = [-1/2, 1/2] \times [-1/2, 1/2] \\
u_0(x,y) = \begin{cases}
\tfrac{1}{4}\left(1+\cos(\frac{\pi(x-x_0)}{\sigma})\right)\left(1+\cos(\frac{\pi(y-y_0)}{\sigma}\right)) & \text{if}~(x-x_0)^2+(y-y_0)^2\leq\sigma^2\\
0~\text{if} & \text{otherwise}
\end{cases} \\
u_{\text{I}}=0 \\
\textbf{a} = \begin{pmatrix}
-y \\
x
\end{pmatrix}
\end{cases}
\end{split}\]
import numpy as np
from ufl import SpatialCoordinate, as_vector
from lucifex.mesh import rectangle_mesh
from lucifex.fem import Constant
from lucifex.fdm import (BE, FE,
    FiniteDifference, FunctionSeries, ConstantSeries,
    advective_timestep)
from lucifex.solver import ibvp , BoundaryConditions
from lucifex.sim import run, Simulation
from lucifex.viz import plot_colormap, save_figure, create_animation, display_animation, plot_streamlines
from lucifex.utils import nested_dict, is_continuous_lagrange, as_indices
from lucifex.pde.advection import advection, dg_advection


def create_simulation(
    element: tuple[str, int],
    Lx: float,
    Ly: float,
    Nx: int,
    Ny: float,
    courant: float,
    D_adv: FiniteDifference,
    sigma: float,
    x0: float,
    y0: float,
):
    mesh = rectangle_mesh((-0.5 * Lx, 0.5 * Lx), (-0.5 * Ly, 0.5 * Ly), Nx, Ny)
    t = ConstantSeries(mesh, name='t', ics=0.0)
    x = SpatialCoordinate(mesh)
    a = as_vector((-x[1], x[0]))
    dt = advective_timestep(a, 'hmin', courant, mesh=mesh)
    dt = Constant(mesh, dt, name='dt')
    u = FunctionSeries((mesh, *element), name='u', store=1)
    ics = lambda x: (0.0 +
        0.25 *
        (1 + np.cos(np.pi * (x[0] - x0) / sigma)) *
        (1 + np.cos(np.pi * (x[1] - y0) / sigma)) *
        ((x[0] - x0)**2 + (x[1] - y0)**2 <= sigma**2)
    )
    bcs = BoundaryConditions(
        ('dirichlet', lambda x: x[0], 0.0),
    )
    if is_continuous_lagrange(u.function_space):
        u_solver = ibvp(advection, ics, bcs)(u, dt, a, D_adv)
    else:
        u_solver = ibvp(dg_advection, ics)(u, dt, a, D_adv, bcs=bcs)
    return Simulation(u_solver, t, dt, exprs_consts=[('a', a)])


Lx = 1.0
Ly = 1.0
Nx = 64
Ny = 64
h = Lx / Nx
sigma = 0.2 * Lx
x0 = Lx / 6
y0 = Ly / 6
courant = 0.8

elem_opts = [
    ('DP', 1),
    ('P', 1),
]
D_adv_opts = (BE, FE)

simulations = nested_dict((FiniteDifference, tuple, Simulation))

for elem in elem_opts:
    for D_adv in D_adv_opts:
        simulations[elem][D_adv] = create_simulation(elem, Lx, Ly, Nx, Ny, courant, D_adv, sigma, x0, y0)

n_stop = 100
for elem in elem_opts:
    for D_adv in D_adv_opts:
        run(simulations[elem][D_adv], n_stop)
for elem in elem_opts:
    fam, deg = elem
    for D_adv in D_adv_opts:
        u = simulations[elem][D_adv]['u']
        a = simulations[elem][D_adv]['a']
        time_indices = as_indices(u.time_series, (0, 0.5, -1),)
        for i in time_indices:
            t = u.time_series[i]
            title = f'{fam}$_{deg}$\n $\mathcal{{D}}=\mathrm{{{D_adv}}}$\n $u(t={t:.3f})$'
            fig, ax = plot_colormap(u.series[i], title=title)
            plot_streamlines(fig, ax, a, mesh=u.function_space.mesh, density=0.75, color='cyan')
            thumbnail = (elem == ('DP', 1) and i == -1 and D_adv is BE)
            save_figure(f'{u.name}(x,y,t={t:.3f})_{fam}{deg}_{D_adv}', thumbnail=thumbnail)(fig)

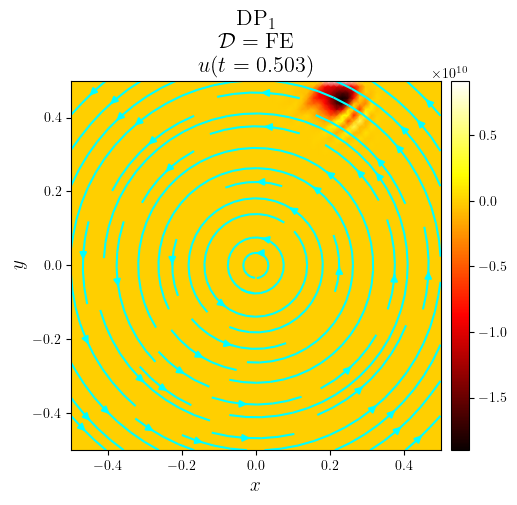
The Kernel crashed while executing code in the current cell or a previous cell.

Please review the code in the cell(s) to identify a possible cause of the failure.

Click <a href='https://aka.ms/vscodeJupyterKernelCrash'>here</a> for more info.

View Jupyter <a href='command:jupyter.viewOutput'>log</a> for further details.
time_slice = slice(0, None, 2)
anim_paths = nested_dict((FiniteDifference, tuple, str))

for elem in elem_opts:
    fam, deg = elem
    for D_adv in D_adv_opts:
        u = simulations[elem][D_adv]['u']
        titles = [f'${u.name}(t={t:.3f})$' for t in u.time_series[time_slice]]
        anim = create_animation(
            plot_colormap,
            colorbar=False,
        )(u.series[time_slice], title=titles)
        anim_path = save_figure(f'{u.name}(x,y,t)_{fam}{deg}_{D_adv}', get_path=True)(anim)
        anim_paths[elem][D_adv] = anim_path

display_animation(anim_paths[('DP', 1)[BE]])