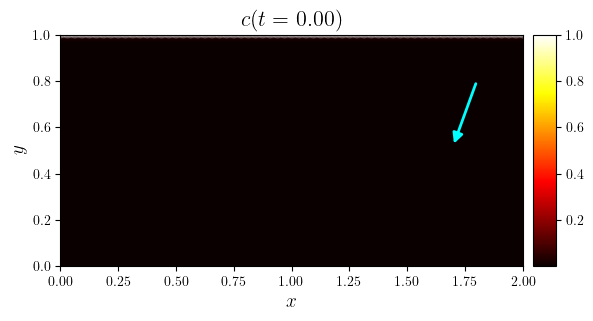
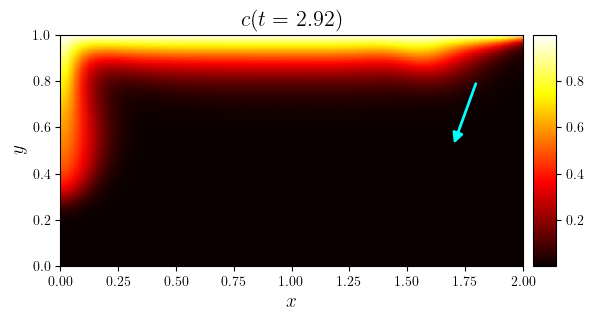
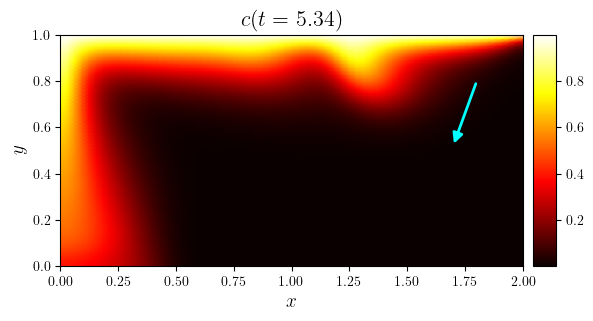
Evolving convection of a Darcy fluid in an inclined porous rectangle#
\[\begin{split}
\mathbb{S}
\begin{cases}
\Omega = [0, \mathcal{A}X] \times [0, X] & \text{aspect ratio } \mathcal{A}=\mathcal{O}(1)\\
e_g^x=-\sin\beta & \text{gravity acting at an angle $\beta$ to the vertical coordinate} \\
e_g^y=-\cos\beta \\
c_0(x,y)=\lim_{\epsilon\to0}\frac{1}{2}\left(1+\text{erf}\left(\frac{y-Ra}{\epsilon Ra}\right)\right)+\mathcal{N}(x,y) & \text{perturbed diffusive base state} \\
c_{\text{D}}(x,y=Ra)=1 & \text{prescribed concentration on upper and lower boundaries} \\
c_{\text{N}}(x,y=0)=0 & \text{no-flux on lower, left and right boundaries}\\
c_{\text{N}}(x=0,y)=0 \\
c_{\text{N}}(x=\mathcal{A}X,y)=0 \\
\psi_{\text{D}}\vert_{\partial\Omega}=0 & \text{no-penetration on entire boundary} \\
\phi = 1 & \text{constitutive relations} \\
\mathsf{D} = \mathsf{I} \\
\mathsf{K} = \mathsf{I}\\
\mu = 1 \\
\rho(c) = c \\
\end{cases}
\end{split}\]
import numpy as np
from matplotlib.patches import FancyArrowPatch
from lucifex.fdm import AB2, CN
from lucifex.sim import run
from lucifex.utils import as_indices
from lucifex.viz import plot_colormap, save_figure, create_animation, display_animation
from py.C01_darcy_evolving import darcy_convection_evolving_rectangle

beta = 20.0
simulation = darcy_convection_evolving_rectangle(
    aspect=2.0,
    Nx=64,
    Ny=64,
    cell='quadrilateral',
    scaling='advective',
    Ra=300.0,
    beta=beta,
    c_ampl=1e-4,
    c_freq=(14, 14),
    c_seed=(456, 987),
    D_adv=AB2,
    D_diff=CN,
)

n_stop = 200
dt_init = 1e-6
n_init = 5
run(simulation, n_stop=n_stop, dt_init=dt_init, n_init=n_init)

c = simulation['c']
time_slice = slice(0, None, 2)
titles = [f'${c.name}(t={t:.3f})$' for t in c.time_series[time_slice]]

anim = create_animation(
    plot_colormap,
    colorbar=False,
)(c.series[time_slice], title=titles)
anim_path = save_figure(f'{c.name}(t)', get_path=True)(anim)

display_animation(anim_path)
arrow_len = 0.3
arrow_start = np.array((1.8, 0.8))
arrow_end = arrow_start - arrow_len * np.array((np.sin(np.radians(beta)), np.cos(np.radians(beta))))

time_indices = as_indices(c.time_series, (0, 0.5, -1), fraction=True)
for i in time_indices:
    fig, ax = plot_colormap(c.series[i], title=f'$c(t={c.time_series[i]:.2f})$')
    arrow = FancyArrowPatch(
        arrow_start,
        arrow_end,
        arrowstyle='-|>',
        mutation_scale=15,
        color='cyan',
        linewidth=2.0,
    )
    ax.add_patch(arrow)
    save_figure(f'{c.name}(t={c.time_series[i]:.2f})', thumbnail=(i == -1))(fig)